Session Breakout Detector (SBD)Overview:
The Session Breakout Detector (SBD) is a TradingView indicator designed to identify and visualize breakouts from major trading sessions. It tracks a selected session (Tokyo, London, or New York) and detects price movements beyond the session's high or low, assisting traders in spotting potential breakout opportunities.
Key Features:
- Session Selection: Choose between Tokyo, London, or New York sessions.
- Breakout Detection Modes:
- Confirmed Bar: Detects breakouts when a candle closes beyond the session's range.
- Intrabar: Detects breakouts as soon as the price exceeds the session's high or low within a
candle.
- Visual Indicators:
- Displays session high, low, and range with a colored box for clear visualization.
- Marks breakouts with green (bullish) or red (bearish) triangles.
- Optional 50-Period SMA: Adds a 50-period Simple Moving Average to the chart for trend
analysis.
- Alerts: Configurable alerts for bullish and bearish breakouts.
Usage Instructions:
1. Select Session: Choose the desired trading session (Tokyo, London, or New York) from the
input settings.
2. Choose Breakout Detection Mode: Select between 'By confirmed bar' or 'By intrabars' based
on your trading preference.
3. Enable SMA (Optional): Toggle the 'Use SMA?' option to display the 50-period Simple Moving
Average.
4. Set Alerts: Configure alerts for breakout signals as per your trading strategy.
⚠️Note: This indicator is intended for informational purposes only and should not be construed as financial advice. Users are encouraged to conduct their own research and consider their individual risk tolerance before making trading decisions.
Wyszukaj w skryptach "session high"

Watermark with Session Boxes (by Rufi)Watermark & Session Boxes - Chart Branding Tool
What it does: Combines professional chart watermarking with automated trading session visualization for clean, branded analysis.
Key Features:
Smart Session Boxes: Auto-draws boxes around Asia (8PM-11:59PM), London (2AM-5AM), and NY (7AM-10AM) sessions using high/low detection
Custom Watermark: Professional text overlay with your brand/tagline
Full Customization: Adjustable colors, transparency (0-100%), and display limits (1-30 days)
How it works: Uses Pine Script's time() function to detect session periods, tracks price extremes during each session, then draws filled rectangles from session high to low. Perfect for identifying key support/resistance levels from major trading periods.
Best for: Intraday traders who want branded charts with clear session-based S/R levels. Ideal for forex, indices, and crypto on lower timeframes.

Pivot Points mura visionWhat it is
A clean, single-set pivot overlay that lets you choose the pivot type (Traditional/Fibonacci), the anchor timeframe (Daily/Weekly/Monthly/Quarterly, or Auto), and fully customize colors, line width/style , and labels . The script never draws duplicate sets—exactly one pivot pack is displayed for the chosen (or auto-detected) anchor.
How it works
Pivots are computed with ta.pivot_point_levels() for the selected anchor timeframe .
The script supports the standard 7 levels: P, R1/S1, R2/S2, R3/S3 .
Lines span exactly one anchor period forward from the current bar time.
Label suffix shows the anchor source: D (Daily), W (Weekly), M (Monthly), Q (Quarterly).
Auto-anchor logic
Intraday ≤ 15 min → Daily pivots (D)
Intraday 20–120 min → Weekly pivots (W)
Intraday > 120 min (3–4 h) → Monthly pivots (M)
Daily and above → Quarterly pivots (Q)
This keeps the chart readable while matching the most common trader expectations across timeframes.
Inputs
Pivot Type — Traditional or Fibonacci.
Pivots Timeframe — Auto, Daily (1D), Weekly (1W), Monthly (1M), Quarterly (3M).
Line Width / Line Style — width 1–10; style Solid, Dashed, or Dotted.
Show Labels / Show Prices — toggle level tags and price values.
Colors — user-selectable colors for P, R*, S* .
How to use
Pick a symbol/timeframe.
Leave Pivots Timeframe = Auto to let the script choose; or set a fixed anchor if you prefer.
Toggle labels and prices to taste; adjust line style/width and colors for your theme.
Read the market like a map:
P often acts as a mean/rotation point.
R1/S1 are common first reaction zones; R2/S2 and R3/S3 mark stronger extensions.
Confluence with S/R, trendlines, session highs/lows, or volume nodes improves context.
Good practices
Use Daily pivots for intraday scalps (≤15m).
Use Weekly/Monthly for swing bias on 1–4 h.
Use Quarterly when analyzing on Daily and higher to frame larger cycles.
Combine with trend filters (e.g., EMA/KAMA 233) or volatility tools for entries and risk.
Notes & limitations
The script shows one pivot pack at a time by design (prevents clutter and duplicates).
Historical values follow TradingView’s standard pivot definitions; results can vary across assets/exchanges.
No alerts are included (levels are static within the anchor period).

Liquidity Sweep Breakout - LSBLiquidity Sweep Breakout - LSB
A professional session-based breakout system designed for OANDA:USDJPY and other JPY pairs.
Not guesswork, but precision - built on detailed observation of institutional moves to capture clear trade direction daily.
Master the Market’s Daily Bank Flow.
---
Strategy Detail:
I discovered this strategy after carefully studying how Japanese banks influence the forex market during their daily settlement period. Banks are some of the biggest players in the financial world, and when they adjust or settle their accounts in the morning, it often creates a push in the market. From years of observation, I noticed a consistent pattern, once banks finish their settlements, the market usually continues moving in the same direction that was formed right after those actions. This daily banking flow often sets the tone for the entire trading session, especially for JPY pairs like USDJPY.
To capture this move, I built the indicator so that it follows the bank-driven trend with clear rules for entries, stop-loss (SL), and take-profit (TP). The system is designed with professional risk management in mind. By default, it assumes a $10,000 account size, risks only 1% of that balance per trade, and targets a 1:1.5 reward-to-risk ratio. This means for every $100 risked, the potential profit is $150. Such controlled risk makes the system safer and more sustainable for long-term traders. At the same time, users are not limited to this setup, they can adjust the account balance in the settings, and the indicator will automatically recalculate the lot size and risk levels based on their own capital. This ensures the strategy works for small accounts and larger accounts alike.
🌍 Why It Works
Fundamentally driven: Based on **daily Japanese banking settlement flows**.
Session-specific precision: Targets the exact window when USDJPY liquidity reshapes.
Risk-managed: Always calculates lot size based on account and risk preferences.
Automatable: With webhook + MT5 EA, it can be fully hands-free.
---
✅ Recommended
Pair: USDJPY (best observed behavior).
Timeframe: 3-Minute chart.
Platform: TradingView Premium (for webhooks).
Execution: MT5 via EA.
---
🔎 Strategy Concept
The Tokyo Magic Breakout (TMB) is built on years of session observation and the unique daily rhythm of the Japanese banking system.
Every morning between 5:50 AM – 6:10 AM PKT (09:50 – 10:10 JST), Japanese banks perform daily reconciliation and settlement. This often sets the tone for the USDJPY direction of the day.
This strategy isolates that critical moment of liquidity adjustment and waits for a clean breakout confirmation. Instead of chasing noise, it executes only when price action is aligned with the Tokyo market’s hidden flows.
---
🕒 Timing Logic
Session Start: 5:00 AM PKT (Tokyo market open range).
Magic Candle: The 5:54 AM PKT candle is marked as the reference “breakout selector.”
Checkpoints: First confirmation at 6:30 AM PKT, then every 15 minutes until 8:30 AM PKT.
* If price stays inside the magic range → wait.
* If a breakout happens but the candle wick touches the range → wait for the next checkpoint.
* If by 8:30 AM PKT no clean breakout occurs → the day is marked as No Trade Day (NTD).
👉 Recommended timeframe: 3-Minute chart (3M) for precise signals.
---
📈 Trade Execution
Entry: Clean break above/below the magic candle’s range.
Stop-Loss: Opposite side of the Tokyo session high/low.
Take-Profit: Calculated by Reward\:Risk ratio (default 1.5:1).
Lot Size: Auto-calculated based on your risk model:
* Fixed Dollar
* % of Equity
* Conservative (minimum of both).
Visuals include:
✅ Entry/SL/TP lines
✅ Shaded risk (red) and reward (green) zones
✅ Trade labels (Buy/Sell with lot size & levels)
✅ TP/SL hit markers
---
🔔 Alerts & Automation (AutoTMB)
This strategy is fully automation-ready with EA + MT5:
1. Enable alerts in TMB settings.
2. Insert your PineConnector License Key.
3. Configure your risk management preferences.
4. Create a TradingView alert → in the message box simply type:
Pine Script®
{{alert_message}}
and set the EA webhook.
Now, every breakout trade (with exact entry, SL, TP, and lot size) is sent instantly.
👉 On your MT5:
* Install the EA.
* Use the same license key.
* Run it on a VPS or local MT5 terminal.
You now have a hands-free trading system: AutoTMB.

samc's FX SESSIONS - on candles So, based on my 8 yrs of experience and over a 2 decade worth of back testing on FX majors pairs one thing i can univocally affirm to the fact that Timing is everything especially in the currency markets.
so i made this indicator to help reduce the noise and focus on signals which is coded by time,
now i made this as GMT+8 in focus but you can adjust based on your requirements.
I classified my indicator colors according to the inter-SESSION High Impact areas only as following :
Primary session colors:
ASIAN - YELLOW
EU - BLUE
US - Magenta (light)
and every first 10 mins of the hour (Great for scalping)
i marked them in a shade of grey.
secondary sessions i marked them as minor sessions.
PRE-EU 1hr of expected trend i marked in color green
and
after hours in a shade of color violet.
so i usually make my candles into light grey by default and remove the body and wicks to minimize the visual stimulus so that this indicator will work great with both dark and light themes and does not obstruct other indicators.
also i made an option to uncheck my naming scheme of session on the top right.

Globex Overnight Futures ORB with FIB's by TenAMTrader📌 Globex Overnight Futures ORB with FIB’s – by TenAMTrader
This indicator is designed for futures traders who want to track the Globex Overnight Opening Range (ORB) and apply Fibonacci projections to anticipate potential support/resistance zones. It’s especially useful for traders who follow overnight sessions (such as ES, NQ, CL) and want to map out key levels before the U.S. regular session begins.
⚙️ How It Works
Primary Range (ORB):
You define a start and end time (default set to 18:00 – 18:15 EST). During this period, the script tracks the session high, low, and midpoint.
Opening Range Plots:
High Line (green)
Low Line (red)
Midpoint Line (yellow)
A shaded cloud between High–Mid and Mid–Low for easy visualization.
Fibonacci Projections:
Once the ORB is complete, the script calculates a full suite of Fibonacci retracements and extensions (e.g., 0.236, 0.382, 0.618, 1.0, 1.618, 2.0).
Standard key levels (0.618, 0.786, 1.0, etc.) are always shown if enabled.
Optional extended levels (1.236, 1.382, 1.5, 2.0, etc.) can be toggled on/off.
"Between Range" fibs (such as 0.382 and 0.618 inside the ORB) are also available for traders who like intra-range precision.
🔧 User Settings
Time Inputs: Choose your ORB start/end time.
Color Controls: Customize high, low, midpoint, and fib line colors.
Display Toggles: Turn on/off High, Low, Midpoint lines and Fibonacci projections.
Fib Extensions Toggle: Decide whether to show only major fibs or all extensions.
Alerts (Optional): Alerts can be set for crossing the ORB High, Low, or Midpoint.
📊 Practical Use Cases
Breakout Traders: Use the ORB high/low as breakout triggers.
Mean Reversion Traders: Watch for rejections near fib extension levels.
Overnight Futures Monitoring: Track Globex behavior to prepare for RTH open.
Risk Management: ORB and Fib levels make for natural stop/target placement zones.
⚠️ Disclaimer
This indicator is provided for educational and informational purposes only. It does not constitute financial advice, investment advice, or trading recommendations. Trading futures involves substantial risk of loss and may not be suitable for all investors. Always do your own due diligence and consult with a licensed financial professional before making trading decisions.


FVG + Bank Level Targeting w/ Alert TriggerDescription:
FVG + Bank Level Targeting w/ Alert Trigger is an intraday trading tool that combines Fair Value Gap (FVG) detection with dynamic institutional targeting using prior-day, weekly, and monthly high/low "Bank Levels." When a Fair Value Gap is detected, the script projects a logical target using the closest bank level in price's direction, and visually extends that level on your chart.
This tool is designed to help traders anticipate where price is most likely to move after an FVG appears — and alert them when price breaks through key target zones.
How It Works:
* Bank Level Calculation:
The indicator calculates Daily, Weekly, and Monthly high and low levels from the previous bar of each respective timeframe.
These are optionally plotted on the chart with a slight tick offset to avoid overlap with price.
* FVG Detection:
Bullish FVGs are defined by a gap between the low of the current candle and the high two candles prior, with a confirming middle candle.
Bearish FVGs follow the reverse pattern.
Once detected, the script finds the nearest unbroken institutional level (Bank Level) in the direction of the FVG and anchors a target line at that price level.
* Target Line Projection:
The script draws a persistent horizontal line (not just a plotted value) at the selected bank level.
These lines automatically extend a set number of bars into the future for clarity and trade planning.
* Breakout Detection:
When price crosses above a Bull Target or below a Bear Target, the script triggers a breakout condition.
These breakouts are useful for trade continuation or reversal setups.
* Alerts:
Built-in alert conditions notify you in real time when price crosses above or below a target.
These can be used to set TradingView alerts for your preferred Futures symbols or intraday pairs.
Parameters:
Tick Offset Multiplier: Adds distance between price and plotted levels.
Show Daily/Weekly/Monthly Levels: Toggle for each institutional level group.
FVG Extend Right (bars): Controls how far the target lines extend into the future.
Color Controls: Customize colors for FVG fill and target lines.
Use Case:
This indicator is designed for traders who want to:
Trade continuation or reversal moves around institutional price zones
Integrate Fair Value Gap concepts with more logical, historically anchored price targets
Trigger alerts when market structure evolves around key levels
It is especially useful for intraday Futures traders on the 15-minute chart or lower, but adapts well to any instrument with strong reactionary behavior at prior session highs/lows.

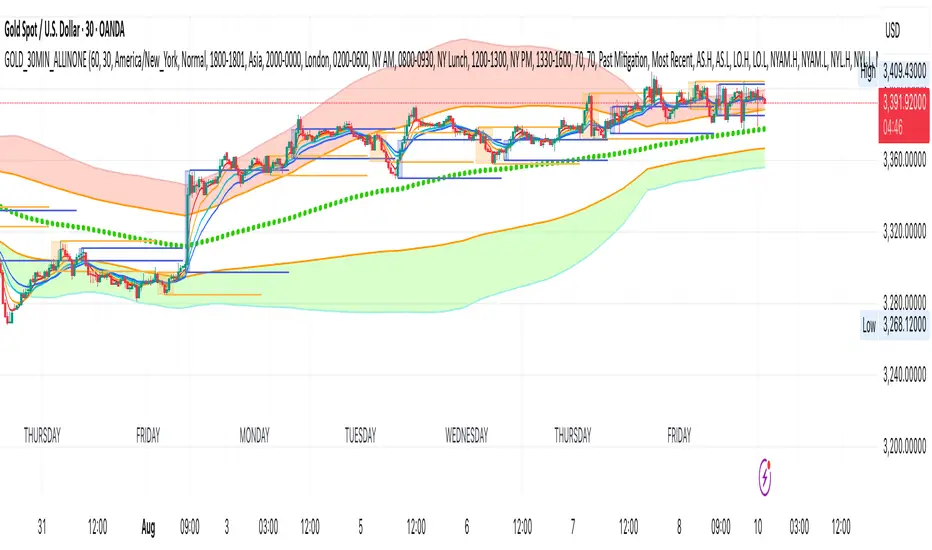
GOLD_30MIN_ALLINONEA comprehensive 30 minute trading tool for XAUUSD trading.
Use in combination of the indicator: 1 minute Easy Scalping Sys v3.0 (by BulltradingAM).
Rules:
1. A solid break out (measure breakout strength from the other indicator mentioned above) from the London session high or low (Orange Boxes), during the first 3 30Min candles of NYC session (Blue Boxes).
2. open position in the direction of the break out, set SL on London session high/low and TP on 1:1 RR or Bollinger Band outer line (for trending trades) and Bollinger Band Base line (for pullbacks and trend reversal trades).
3. No long trades in Bollinger red section and no short trades in Bollinger green section.
More Information:
You need the indicator only for the breakout candle momentum strength with the following indicator settings:
Timeframe 1: 1 Day
Timeframe 2: 30 Minutes
Timeframe 3: 30 Minutes
Timeframe 4: 30 Minutes
and set the week candles fill to blank for easy identification.
You will not need ATRs or Hulls lines or anything else from the other indicator.
ORB Scalp setup on 15min by UnenbatThis indicator draws a 2-minute Opening Range Box (ORB) at the beginning of each 15-minute candle by combining the last minute of the previous candle and the first minute of the current one. It highlights the session high/low during this range, and extends the box for a customizable duration. TP and BE lines are also plotted above/below the range for strategic planning. Perfect for scalpers using 15-minute timeframe.

Sessions and High/Low/andrewSessions and High/Low/andrew
this indictors covers all the session high and low including frankfurt

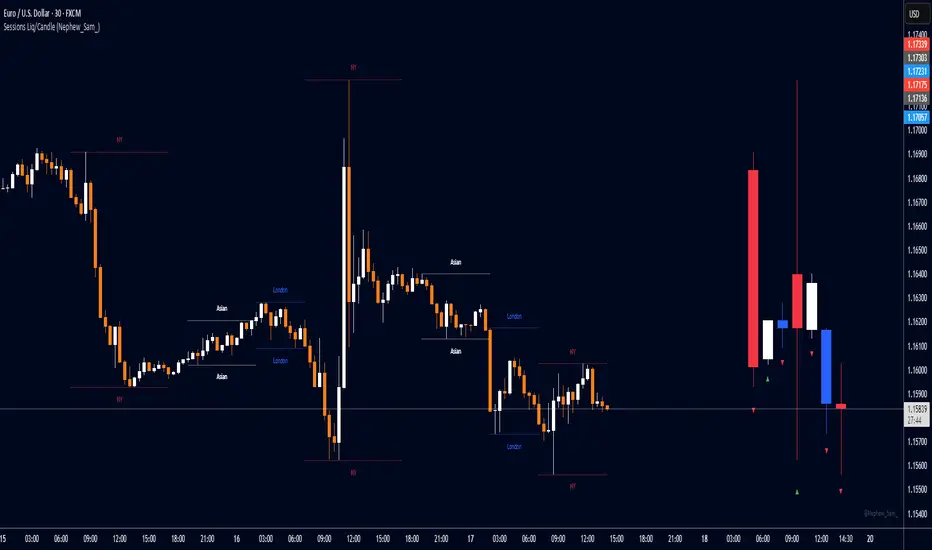
Session HL + Candles + AMD (Nephew_Sam_)Session HL + Candles + AMD (Nephew_Sam_)
This indicator marks out intraday sessions summarized into single candles, with an additional option to mark out the HL of each session. Perfect for understanding AMD within a glance (accumulation-manipulation-distribution)
Features:
Session High/Low lines with customizable colors and labels
Optional session candles displayed on the right side of the chart
Timezone support for global traders
Customizable bull/bear candle colors
Works on timeframes up to 1 hour
Perfect for:
Identifying session liquidity levels
Tracking session ranges and breakouts
Multi-timeframe session analysis
ICT methodology traders
Settings:
Choose your timezone for accurate session detection
Toggle session candles and HL lines independently
Customize colors, line styles, and labels
Set maximum timeframe (up to 1 hour)
Navy Seal Trading - EdgarTrader📌 Navy Seal Trading – Asia, London, and NY Sessions
This indicator clearly displays the ranges of the Asia, London, and New York sessions, featuring:
✅ Full range visualization for each session
✅ Asia session high, low, and midline, with extended projection lines for precise reaction analysis
✅ Clean, minimalistic, and professional colors to keep your chart focused
🔷 Designed for the Navy Seal Trading community, focused on precision, discipline, and professional execution in the markets.
Use it to:
✔️ Mark liquidity zones
✔️ Identify Asia manipulation ranges
✔️ Prepare executions in London and NY with clear context
💡 Remember: Clarity in your zones gives you the confidence and discipline to execute like a true Navy Seal Trader.

ES OHLC BASED ON 9:301. RTH Price Levels
YC (Yesterday's Close): Previous day's RTH closing price at 4:00 PM ET
0DTE-O (Today's Open): Current day's RTH opening price at 9:30 AM ET
T-E-M (Today's Europe-Asia Midpoint): Midpoint of overnight session high/low
T-E-R (Today's Europe-Asia Resistance): Overnight session high
T-E-S (Today's Europe-Asia Support): Overnight session low
Y-T-M (Yesterday-Today Midpoint): Midpoint between YC and 0DTE-O
2. Previous Bar Percentage Levels
Displays 50% retracement level for all bars
Shows 70% level for bullish bars (close > open)
Shows 30% level for bearish bars (close < open)
Lines automatically update with each new bar
3. Custom Support/Resistance Lines
Up to 4 customizable horizontal levels (2 resistance, 2 support)
Useful for marking key psychological levels or pivot points
4. VIX-Based Options Strategy Suggestions
Real-time VIX value display
Time Zone Handling
The indicator is configured for Central Time (CT) as Pine Script's default:
RTH Open: 8:30 AM CT (9:30 AM ET)
RTH Close: 3:00 PM CT (4:00 PM ET)
Overnight session: 7:00 PM CT to 8:30 AM CT next day
Usage Notes
Chart Requirement: This indicator only works on 5-minute timeframe charts
Auto-refresh: All lines and labels automatically refresh at each new trading day's RTH open
24-hour Market: Designed for ES futures which trade nearly 24 hours
Visual Clarity: Different line styles and colors for easy identification
Ideal For
Day traders focusing on ES futures
0DTE options traders needing key reference levels
Traders using overnight gaps and previous day's levels
Those incorporating VIX-based strategies in their trading

Recent Session High Low Marker - SimpleDescription:
This Pine Script marks the high and low points of the most recent trading sessions: Asian, London, and New York.
Asian Session: From 19:00 to 21:00 New York time (UTC-4).
London Session: From 02:00 to 05:00 New York time (UTC-4).
New York Session: From 07:00 to 10:00 New York time (UTC-4).
For each session, the script draws two lines:
One for the high of the session.
One for the low of the session.
The lines are drawn horizontally across the chart, making them easy to spot. Each session is marked by two lines with specific colors:
Orange for the Asian session.
Blue for the London session.
Purple for the New York session.
The lines are dynamically updated during the active session, and they will reset when the next session begins. The width of the lines is set to 2 to ensure they are visible without being too thick.
Credits:
Script created by Jdv.

SessionBarThis PineScript is designed to display various visual elements on a chart to help traders track session activity within the lower time frames, specifically for the USA main session. Here's a breakdown of the script's functionality:
Session Tracking
The script tracks the USA main session, defined as 9:30 AM to 4:00 PM ET, Monday through Friday.
Visual Elements
The script displays various visual elements, including:
1. Session Open and Close Lines: Lines marking the open and close of the USA main session.
2. Session High and Low Lines: Lines marking the high and low of the USA sessions.
3. Active Session Bar: A Realtime Candle as the current session bar.
4. Overnight Session Bar: A Realtime Candle as the overnight session bar.
5. Session Timer: A label displaying the time left until the next session.
6. Background Colors: Colors indicating different session periods, such as pre-market, post-market, and active session.
Customization
The script allows users to customize various aspects, including:
1. Session Time: Users can adjust the session time.
2. Colors: Users can choose colors for different visual elements.
3. Display Options: Users can toggle the display of various visual elements.
Overall, this script provides a educational tool for traders to track session activity and visualize key market data.

Initial Imbalance [First FVG - ICT] v1Initial Imbalance v1
This indicator identifies the first Fair Value Gap (FVG) at the start of a user-defined session, inspired by The Inner Circle Trader. It helps traders spot initial imbalance in a sessions price action, offering filter options to refine FVG detection and optional session high/low lines for context.
Features:
Detects the first bullish or bearish FVG at the session start (default: 08:30). ISE: Sets a custom session start time (hour and minute).
Filters FVGs by size: None, ATR-based, or Points-based.
Displays session high/low lines (optional) to visualize the session range.
Customizable colors for bullish and bearish FVGs (background and border derived from a single color input).
Alerts for new FVGs and mitigated FVGs.
Settings:
Session Start Time: Define the hour and minute for the session start.
FVG Filter Type: Choose None, ATR, or Points to filter FVGs by size.
ATR Multiple / Minimum Points: Set the minimum FVG size for ATR or Points filters.
Show Session High/Low Lines: Toggle visibility of session range lines.
Bullish/Bearish FVG Colors: Customize colors for FVGs.
Technical Details:
Overlay indicator, displayed directly on the price chart.
This indicator is ideal for traders seeking to identify key price imbalances at the start of a session, with flexible filtering and visualization options.

Key LevelsI couldn't find an indicator that plotted previous day and intraday key levels like I wanted.
This indicator plots key levels on the chart:
Current session high (HOD) and low (LOD)
Previous day high (PDH), low (PDL), and close (PDC)
Overnight high (ONH) and low (ONL) based on a defined overnight window
At the start of a new session (day), the indicator resets its values and creates a new set of labels.
These labels are positioned in a fixed horizontal column (offset from the current bar) and are updated each bar so that they remain vertically aligned with their corresponding level (with a small vertical offset).
Inputs you can modify:
Futures Mode and session times for equities and futures.
Horizontal label offset (in bars) and vertical offset (price units) for label positioning.
Colors, line widths, and styles for each level (day high, day low, overnight high/low, previous day levels).
Adjust these inputs to match your market hours and desired appearance.
Zero background in coding, but worked with chatGPT to develop this, and it works for me. Would welcome any and all feedback.

ALN Sessions - for NQ2/24/25 - v1
This script does not calculate any stats.
It uses the sessions and stats from NQStats/ALNSessions
Option to draw boxes around the session times.
Options to adjust the table text/background colors/position.
The logic will determine how the Asia and London sessions interact.
Once the New York session starts (8am), it will then display the appropriate stats.
Script quirk...fyi. The script removes the stats table at 6PM.
That's just how it works. I used grok to assist with the code, and it got funky. It works, so I left it that way.
The appropriate stats table will then be displayed when the next New York session begins.
---
There is another table I used just for troubleshooting to show the values of the Asia/London session highs/lows. This can just be ignored.
3/3/25 - republished.

Average Daily Range ProjectionsCreates a trailing high and low projection based on the Average Daily Range.
Track the Session High and Low to determine the Daily Range.
Average the Daily Range by a fixed Period to create an Average Daily Range .
Track the Prior Daily Range .
Track the Current Daily Range .
Track the % of Range completion relative to the CDR & ADR(P).
From the Session Low, project an Average Daily Range High by adding the ADR.
From the Session High, project an Average Daily Range Low by subtracting the ADR.
When %R reaches 100% or greater, the ADR HI & LO will lock, showing the range break out or break down. As the Session High and Low create the Daily Range, observe the reaction of price as it reaches the limit of the expected daily range.
On strongly trending days, CDR is likely greater than PDR and ADR(P). Price can break away.
On ranging days, %R may fail to reach 100% and CDR may be lesser than PDR and ADR(P). Price can bounce around within the bounds of ADR HI & LO.

ICT Killzones + Macros [TakingProphets]The ICT Killzones indicator is a powerful tool designed to visualize key trading sessions and market timing elements used in ICT (Inner Circle Trader) methodology. It includes:
• Session Markers:
- Asia Session
- London Session
- NY AM Session
- NY Lunch Session
- NY PM Session
• Key Price Levels:
- Session high/low levels that extend until violated
- Midnight Open price level (dotted line)
- True Day Open price level (6 PM EST, dotted line)
• ICT Macro Timing:
- First Macro: 9:45 AM - 10:15 AM EST
- Second Macro: 10:45 AM - 11:15 AM EST
- Distinctive L-shaped brackets marking start and end times
Features:
• Fully customizable colors and styles for all elements
• Adjustable label positions and sizes
• Toggle options for each component
• Smart timeframe filtering
• Clean, uncluttered visual design
This indicator helps traders identify key market structure points, session transitions, and optimal trading windows based on ICT concepts.

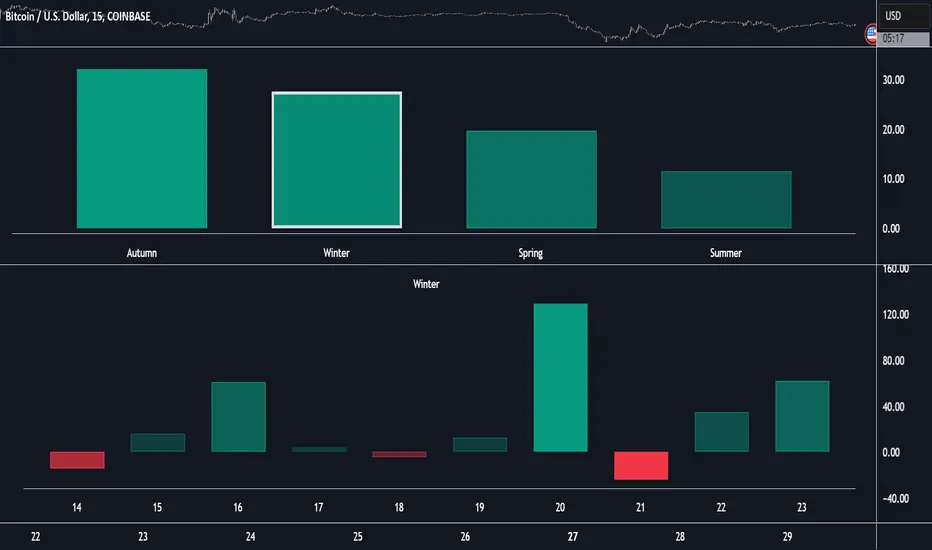
Market Performance by Yearly Seasons [LuxAlgo]The Market Performance by Yearly Seasons tool allows traders to analyze the average returns of the four seasons of the year and the raw returns of each separate season.
🔶 USAGE
By default, the tool displays the average returns for each season over the last 10 years in the form of bars, with the current session highlighted as a bordered bar.
Traders can choose to display the raw returns by year for each season separately and select the maximum number of seasons (years) to display.
🔹 Hemispheres
Traders can select the hemisphere in which they prefer to view the data.
🔹 Season Types
Traders can select the type of seasons between meteorological (by default) and astronomical.
The meteorological seasons are as follows:
Autumn: months from September to November
Winter: months from December to February
Spring: months from March to May
Summer: months from June to August
The astronomical seasons are as follows:
Autumn: from the equinox on September 22
Winter: from the solstice on December 21
Spring: from the equinox on March 20
Summer: from the solstice on June 21
🔹 Displaying the data
Traders can choose between two display modes, average returns by season or raw returns by season and year.
🔶 SETTINGS
Max seasons: Maximum number of seasons
Hemisphere: Select NORTHERN or SOUTHERN hemisphere
Season Type: Select the type of season - ASTRONOMICAL or METEOROLOGICAL
Display: Select display mode, all four seasons, or any one of them
🔹 Style
Bar Size & Autofit: Select the size of the bars and enable/disable the autofit feature
Labels Size: Select the label size
Colors & Gradient: Select the default color for bullish and bearish returns and enable/disable the gradient feature
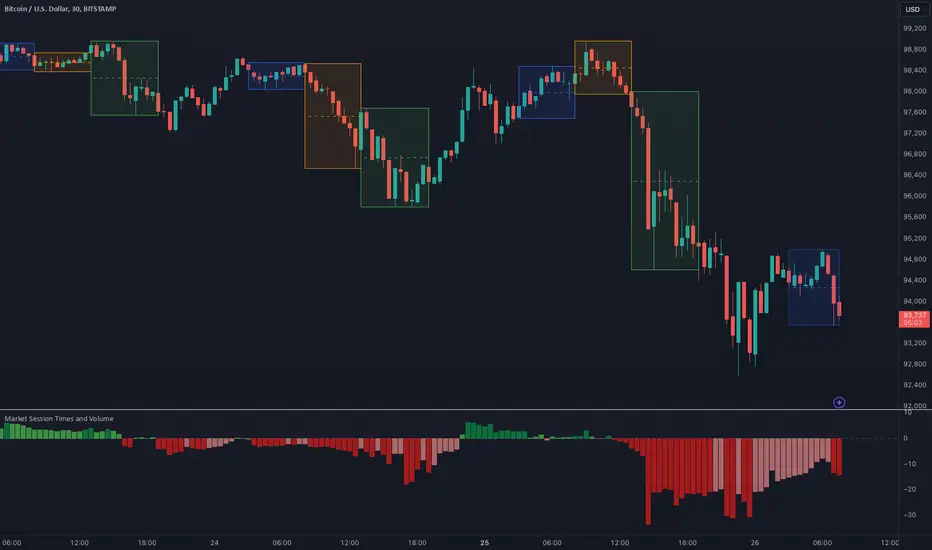
Market Session Times and Volume [Market Spotter]Market Session Times and Volume
Market Session Times
Inputs
The inputs tab consists of timezone adjustment which would be the chosen timezone for the plotting of the market sessions based on the market timings.
Further it contains settings for each box to show/hide and change box colour and timings for Asian, London and New York Sessions.
How it works
The indicator primarily works by marking the session highs and lows for the chosen time in the inputs, each of the sessions can be input a custom time value which would plot the box. It helps to identify the important price levels and the trading range for each individual session.
The midpoint of each session is marked with a dashed line. The indicator also marks a developing session while it being formed as well to identify potential secondary levels.
Usage
It can be used to trade session breakouts, false breaks and also divide the daily movement into parts and identify possible patterns while trading.
2. Volumes
Inputs
The volume part has 2 inputs - Smoothing and Normalisation. The smoothing period can simply be used to take in charge volumes of last X bars and normalisation can be used for calculating relative volumes based on last Y bars.
How it works
The indicator takes into account the buy and sell volumes of last X bars and then displays that as a relative smoothed volume which helps to identify longer term build or distribution of volume. It plots the positive volume from 0 to 100 and negative volume from 0 to -100 which has been normalised. The colors identify gradual increase or decrease in volumes
Usage
It can also be used to trade volume spikes well and can identify potential market shifts